

Learn
Over twenty years of experience in data science enablement.
We’ve facilitated over 500 courses in statistics, data science and predictive analytics. Role and product based training for executives, managers, business analysts, administrators and data scientists.
All courses are live, online and instructor led.

How to predict Customer Churn Course
Learn how to prepare a data table for Churn modelling, build a good model and score current customers.
Date: On Request
Schedule:
9:15 – 10:30am – Session 1
10:30 – 10:45am Break
10:45 – 12:00pm – Session 2
Duration: 2.5 hours online x 2 days
Price: Contact Us
Who will Benefit: Anyone that would like to build a Churn modelling in their organisation, including Business analysts, advanced analysts, quants and data scientists.
Course outline:
- Start with a business case
- How to build a data table, that supports customer Churn modelling, one column at a time
- Include the most important metrics that have consistently proven to influence Customer Churn.
- Understand and apply two models that have consistently performed well in predicting Churn
- Share secrets that statisticians use to build good models, with the open-source version of RapidMiner.
- Leverage AutoML, where RapidMiner does the feature selection, engineering and model validation for you, to help you select the best model and save time and effort.
- Know the common pitfalls, that will invalidate your model
- How to score your current customers with the best model
- What to do with the predictions
Data Science Foundations Course
Learn how to prepare data for modelling, build strong predictive models, evaluate model quality with respect to different performance criteria and select best model(s).
Duration: 2.5 hours online x 2 sessions, with a principal data scientist.
Delivery Options:
- Point/click with RapidMiner
- Code with R:
Who will Benefit:
- Point/Click: Business analysts, advanced analysts, quants and data scientists.
- Code: Data Scientists and quants.
Course outline:
- Introduction and business scenario
- CRISP-DM
- User interface
- Creating and managing repositories
- Loading data and summary statistics
- Visualising data
- Data preparation, handling missing values, normalisation, etc
- k-Nearest Neighbour
- Naïve Bayes
- Linear Regression
- Tree based methods, including bagging, random forest and GBM
- Ensemble modelling
- Bias, Variance, Overfitting and Underfitting
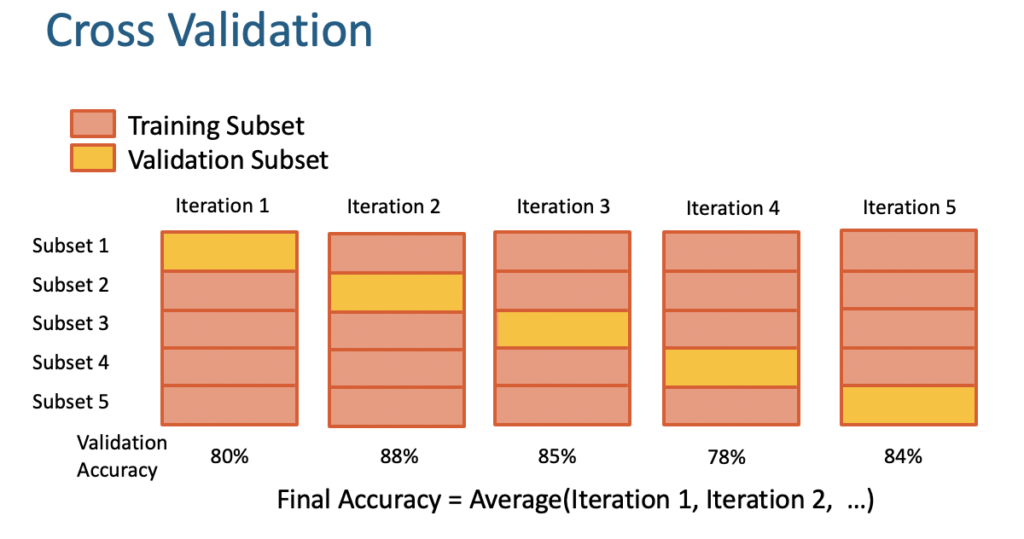
- Split and cross validation
- Evaluation methods & performance criteria
- Optimisation and parameter tuning
- Scoring models
Course materials available, on purchase.
A$1,080/attendee + gst

Data Science Advanced Course
Builds on the Data Science Foundations course with more advanced data preparation, modelling building and sophisticated analytical approaches for evaluation.
Duration: 2.5 hours online x 2 sessions, with a principal data scientist.
Delivery Options:
- Point/click with RapidMiner
- Code with R:
Who will Benefit:
- Point/Click: Advanced analysts, quants and data scientists.
- Code: Data Scientists and quants.
Course outline:
- Introduction and business scenario
- Loading data and summary statistics
- Visualising data
- Advanced data preparation, joins
- Feature generation and feature engineering
- Support Vector Machines
- Neural Networks
- Logistic Regression
- Advanced performance criteria
- ROC Plots
- Comparison between Models
- Feature Selection: Forward Selection, Backward Elimination
- Principal Components Analysis
- Performance (Cost) Model Optimization
- Outlier Detection
Course materials available, on purchase.
A$1,080/attendee + gst
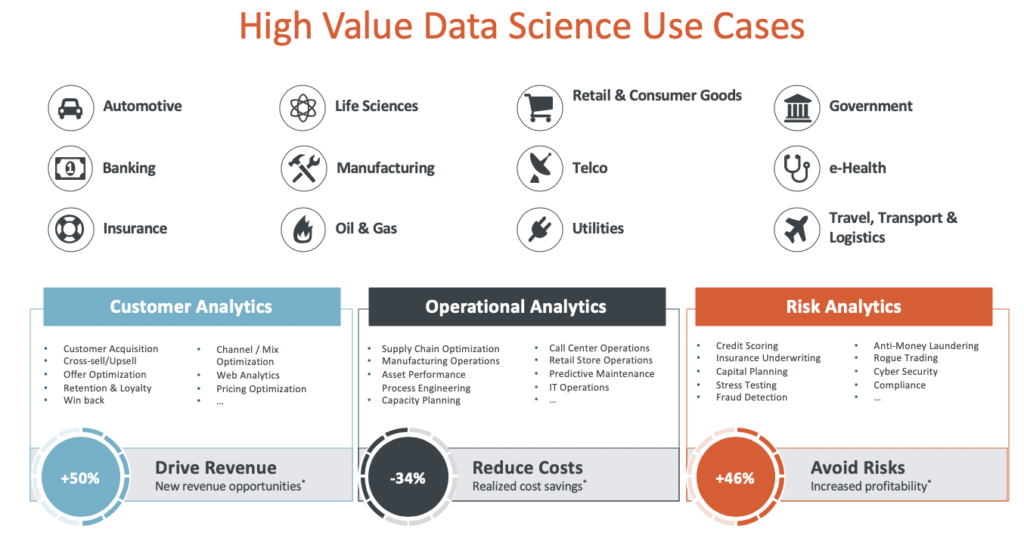
Data Science/AI Applications and Use Cases Course
Learn how Data Science and AI can help achieve business value, with AI transformation programs and high level use cases that accelerate competitive advantage.
Duration: 2 hours online x 2 sessions, with a principal data scientist.
Who will Benefit: Executives and business and product managers.
Course outline:
- Introduction
- What is AI, machine learning and data science
- Identify problems that are good candidates
- Common use-cases
- Data Science POC vs Pilot
- AI transformation program
- Cross industry standard for data mining
- AI and ethics
Course materials available, on purchase.
A$1,080/attendee + gst
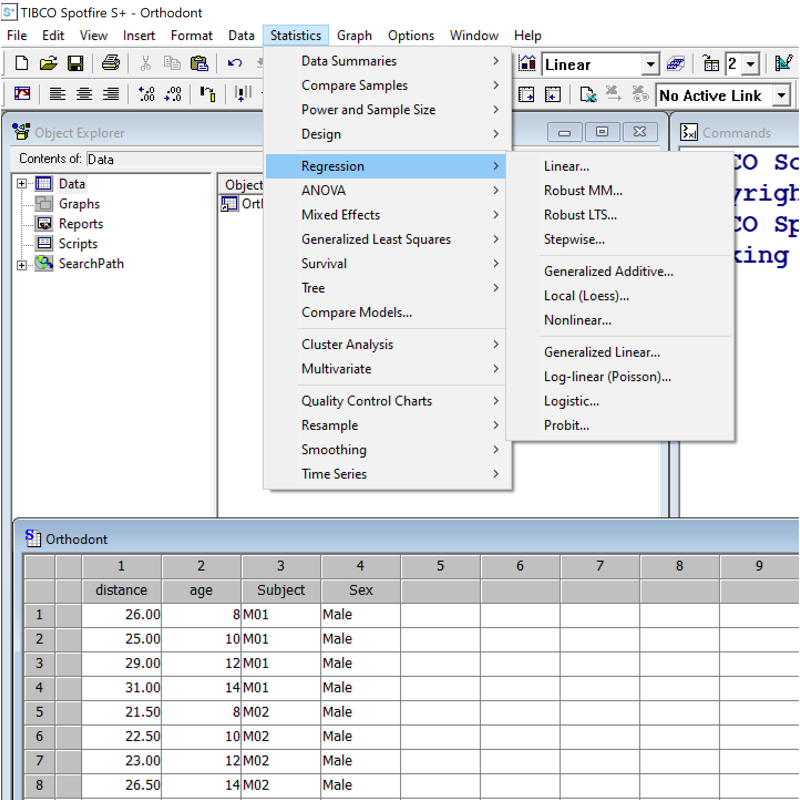
Getting Started with S+ Course
Learn how to visualise data and build statistical models with a few mouse clicks.
Duration: 2.5 hours online x 2 sessions, with a principal data scientist.
Who will Benefit: Statisticians and analysts
Course outline:
- Introduction to the S+ point & click Interface
- Accessing Help
- Creating Working Directories for different projects.
- Data Import/Export & Editing
- Data Manipulation including Stack, Subset & Merge
- How to Create & Edit Graphics – Histograms, Box Plots, Bar Charts, Scatter Plots & 3D Plots
– Changing symbols, colours, style of points, axes, range etc
– Labelling & Identifying Points. Adding Titles etc
– Multiple Graphs on a single graphsheet. - Exporting Graphics
- Linear and Non-Linear Regression via drop-down menu
Course materials available, on purchase.
A$1,080/attendee + gst
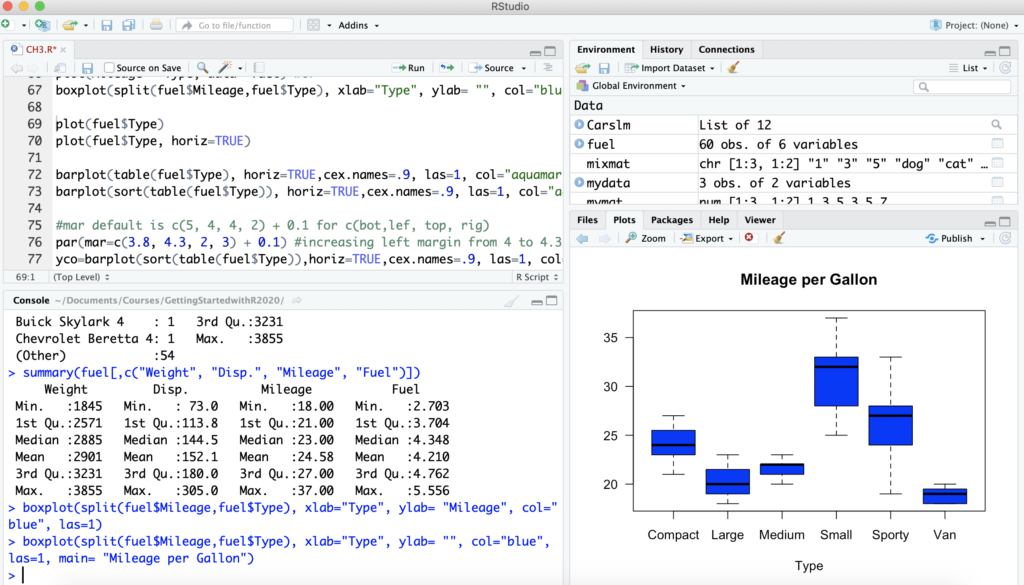
Getting Started with R
Learn how to import, visualise and analyse data in R, avoid common pitfalls and work with R objects/packages.
Duration: 2.5 hours online x 2 sessions
Who will Benefit: Business analysts, Data scientists that are new R users. No experience in R, is necessary. Course has largely been developed with input from customers, through experience in providing support, training and consulting.
Course outline:
- Introduction to R
- Accessing Help
- Creating Working Directories for different projects.
- R Language Objects & Classes
- Data Import/Export
- Data Manipulation including Stack, Subset & Merge
- Data Analysis & Graphics
– Histograms, Box Plots, Bar Charts, Scatter Plots
– Changing symbols, colours, style of points, axes, range etc
– Labelling & Identifying Points. Adding Titles etc
– Multiple Graphs on a single graphsheet.
– Plotting Subsets of Rows
– Adding points, lines, legends to existing plots - Exporting Graphics
- Statistical Models in R
– Linear Regression
– Non-linear Regression
Course notes and code, available, on purchase.
A$990 + gst
Intermediate R
Learn best practices, efficient code for data preparation, create advanced visualisations, run multiple regression models and tree based methods.
Duration: 2 hours online x 2 sessions, with a principal data scientist.
Who will Benefit: Data scientists, quants + relatively new and existing R users that are interested in the latest functions for modelling and to improve efficiency and
Course outline:
- Introduction & Preliminaries
- Efficient use of R Language objects & functions
- Programming in R – writing functions
- Advanced Visualisations, including Trellis and ggplot2
- Data Science/Predictive Modelling:
– Multiple regression
– Stepwise regression
– Regression tree based methods
– Accuracy measures
– Validation
Course notes and code, available, on purchase.
A$1,080/attendee + gst
Advanced R
Learn how to visualise large datasets using the latest out-of-memory, big data packages and build/validate classification models, Churn/loyal, Yes/no, etc.
Duration: 2.5 hours online x 2 sessions, with a principal data scientist.
Who will Benefit: Data scientists, that are interested in big data options and validating classification models.
Course outline:
- Working with Big Data in R
– Big data graphics, models and manipulation - Classification modelling:
– Logistic regression
– Discriminant Analysis
– Trees: Bagging, Random Forest & Boosting
– SVM
– Accuracy measures
– Validation - Automation in R, including batch processing and deploying to production
- Reporting: R Shiny and R Markdown
Course notes and code, available, on purchase.
A$1,080/attendee + gst