Spotfire is the only data visualisation and predictive analytics dashboard, that contains an in-built commercial grade R engine, and is a recognised data prep leader by Forrester Wave.
Spotfire Desktop contains a user friendly interface for visualising data and creating interactive dashboards, without requiring a TIBCO Spotfire Server.
AI-driven Recommendations
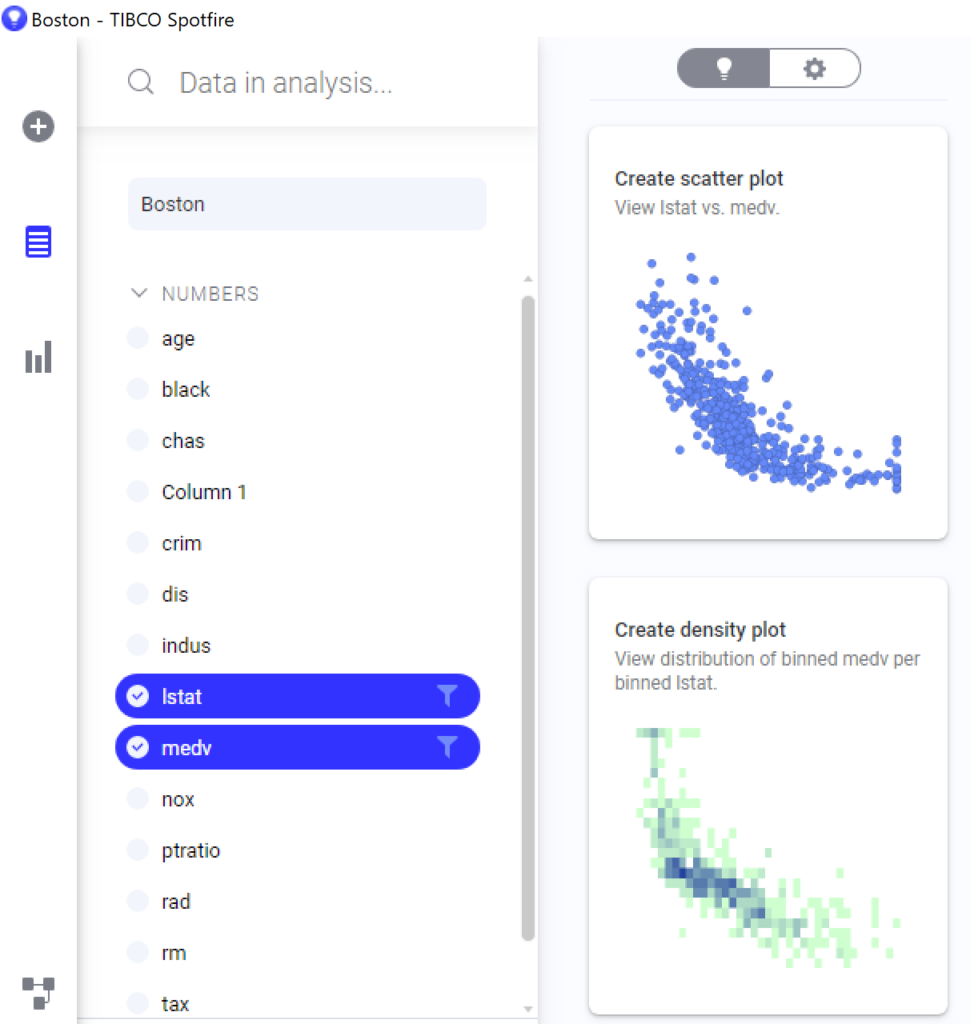
AI powered recommendations, instantly display visualisations for different relationships in your data. Making it faster and easier to get the insights you expect—as well as those that surprise.
Recommendations also help you mashup data from multiple sources in a single visualization—and load, link, categorize, and navigate data.
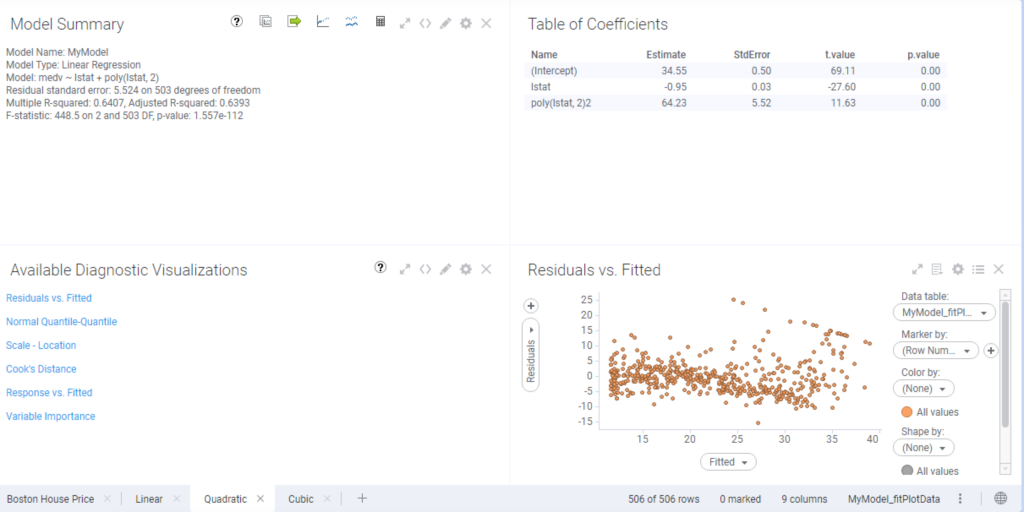
Built-in Predictive Analytics
Out-of-the-box predictive methods for regression, classification, clustering, and forecasting. Enable everyone with predictive analytics. Visualise input data and results in Spotfire interactive dashboards. Deeper data science calculations are available through TIBCO Data Science or Spotfire Data Functions, which leverage R, Python, SAS, and Matlab code.
Unique Data Science Language Integration
Build custom predictive models, through Data Functions. TIBCO® Enterprise Runtime for R (TERR) runs inside any analysis. Train R models (or python) and deploy with TERR. Use popular advanced analytics packages and databases. Integrate multiple tables, columns, and values with point-and-click visualizations, not possible with other products.
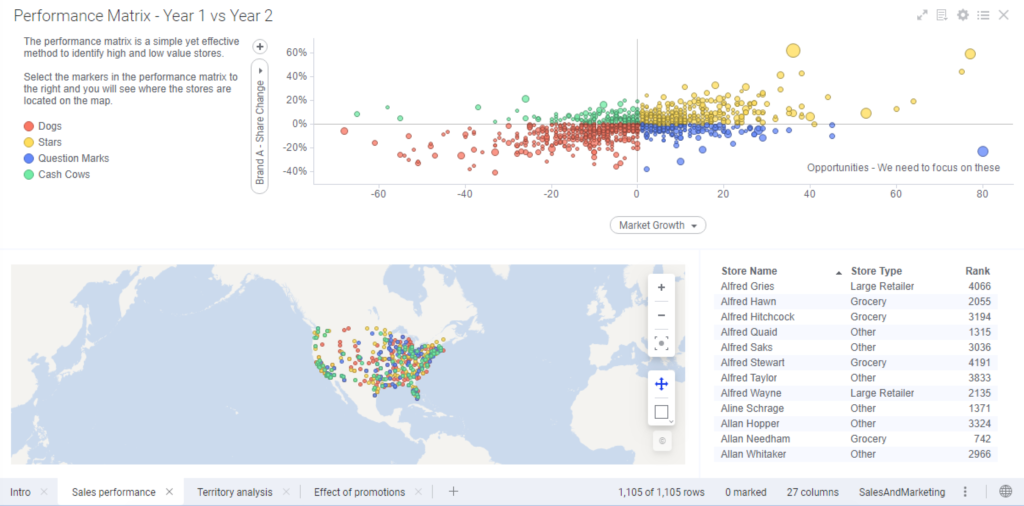
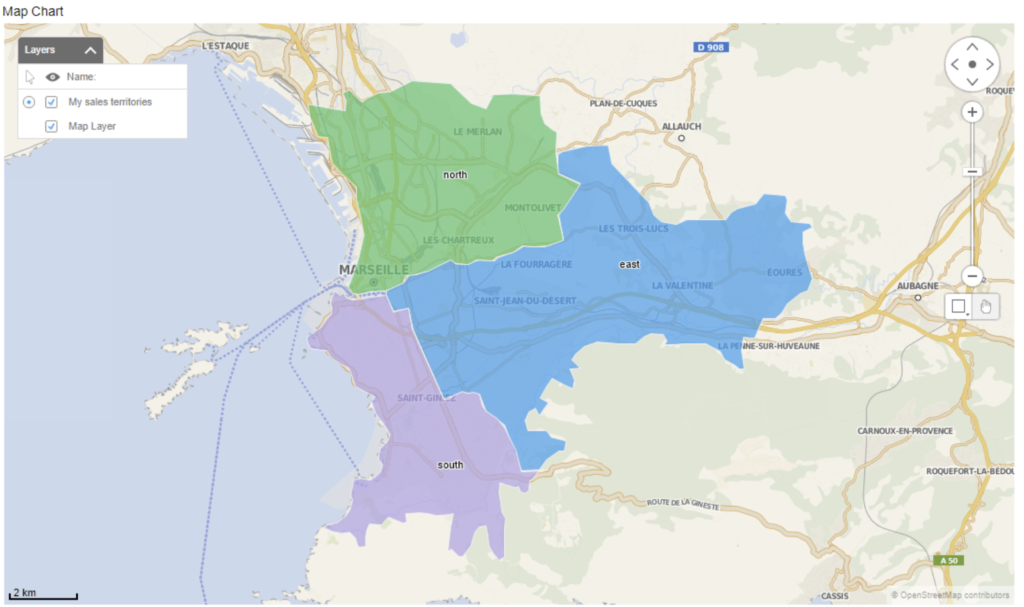
Unparalleled Location Analytics
Bring geographic context to your analysis with instant multi-layer maps, geocoding, and reverse geocoding. Maps help generate insights and make predictions not possible using tables and charts. Deeper geo-analytics can be done, using the built-in R engine and TIBCO® GeoAnalytics.
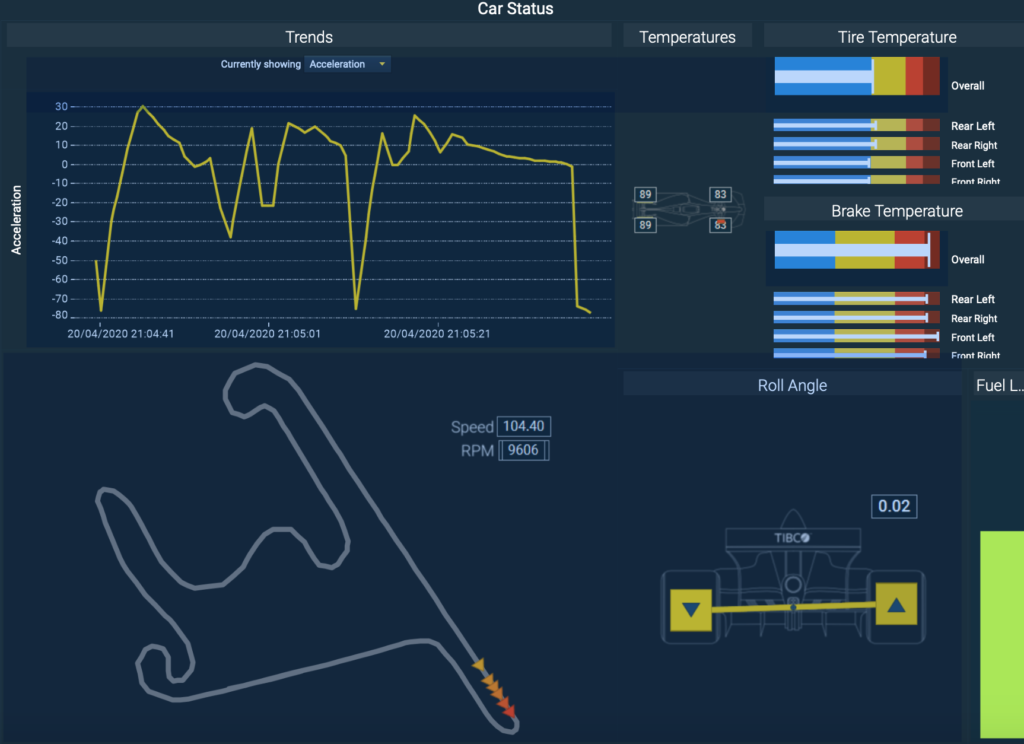
Real-time Streaming Analytics
Spotfire Data Streams continually pushes new data to Spotfire for real-time analysis. Create interactive dashboards with real-time IoT (MQTT, OSI PI), social, and messaging (TIBCO, JMS, Kafka) sources, as easily as with static data. Imagine what analytics can do for frequently changing data. To provide a real-time view into your business, continuous updates are pushed to users, enabling analysis and action while it still matters.
Past data can be added for full contextual awareness. Inventory management to financial fraud detection, and ground-staff operations to predictive maintenance, Spotfire® Data Streams augments your intelligence with the power of real-time analytics.
Feature List
User Interface
File import and export dialogs
Database import and export dialogs
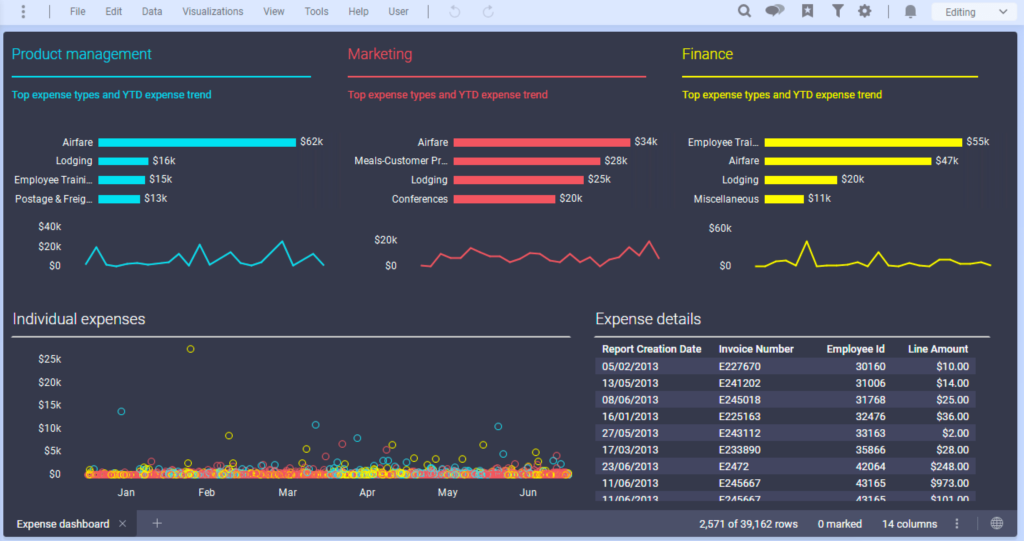
Point and click dashboards are combination of visualisations and pages to showcase insights
Assists you in analysing the data by providing recommendations on visualizations that fit the data you want to display
Data Canvas provides an overview on how each data table in the analysis was created, and you can add data or edit settings for different data sources
When you add a visualisation to an analysis, you can:
– Start by selecting data
– Start by selecting visualisation type
– Search for what you’d like to visualise
Copy-and-paste to Word, PowerPoint and Excel
Export visualisation to Image or PDF and data to a file
Export dashboard to PDF or Microsoft PowerPoint
Create custom toolbars
On-line help, manuals and how to videos
Integrate with many data formats
Load data into the internal data engine of TIBCO Spotfire (in-memory analysis) from a number of different sources
– by pasting data from the clipboard
– by dragging and dropping or opening simple text files, Microsoft Excel files or SAS files
– by connecting to a database via ODBC or OLE DB
ASCII: fixed format, comma-separated, and tab-delimited – (*.csv), (*.txt)
Microsoft Excel Workbook
Spotfire Analysis file (*.dxp)
Script Function Definition (*.sfd)
TIBCO Spotfire Text Data format
Microsoft Access Databases
SAS (*.sas7bdat)
Universal Data Link (*.udf)
Sfs file (*.sfs)
Spotfire Server Log Files (*.log)
Spotfire Binary Data Format (*.sbdf)
ESRI Shape Files (.shp)
Amazon Redshift
Apache Drill
Apache Spark SQL
Attivio
Cloudera Hive
Cloudera Impala
Dremio
Google Analytics
Google BigQuery
Hortonworks
IBM DB2
IBM Netezza
Microsoft SQL Server
Microsoft SQL Server Analysis Services
OData
Oracle
Oracle Essbase
Oracle MySQL
Pivotal Greenplum
Pivotal HAWQ
PostgreSQL
Salesforce
SAP BW
SAP HANA
Snowflake
Teradata
Teradata Aster
TIBCO Cloud™ Live Apps
TIBCO ComputeDB
TIBCO Data Virtualization
TIBCO Spotfire Data Streams
Vertica
Visualisations
Table
Cross Table
Graphical Table
Bar Chart
Waterfall Chart
Line Chart
Combination Chart
Pie Chart
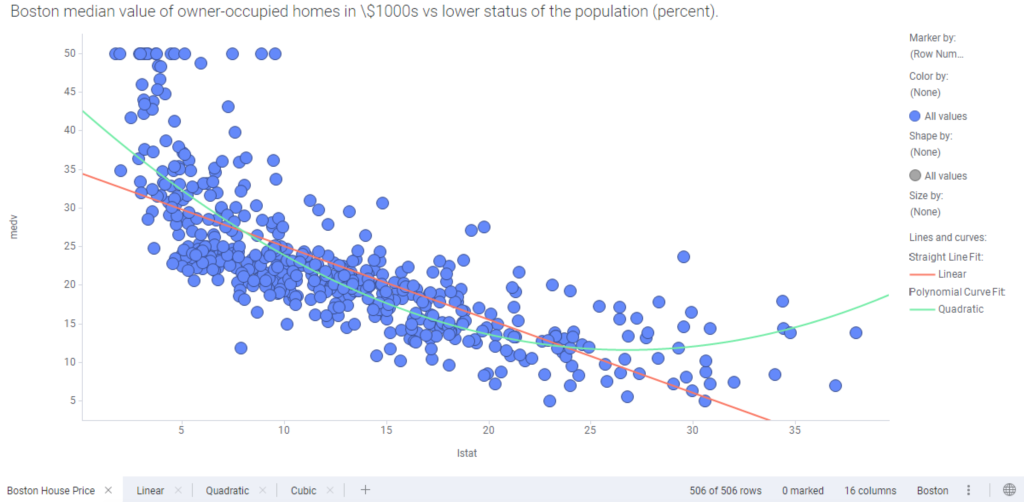
Scatter Plot + add linear and non-linear statistical model curves with a few clicks
3D Scatter Plot
Map Chart
Treemap
Heat Map
KPI Chart
Parallel Coordinate Plot
Summary Table
Box Plot
Text Area
Edit colours, lines, axes, annotations and layout
Interact with visualisations by marking, highlighting, drag-and-drop and zoom sliders
Multiple data tables in one visualisation
Hierarchies
Trellis Visualisations – create multiple charts conditioned by levels of one or more variables
Details Visualisations – selecting points on a main visualisation allows drill down on a 2nd and subsequent visualisations
TIBCO® Enterprise Runtime for R (TERR)
In-built high-performance statistical engine that is compatible with open-source R.
Provided in your installation of Spotfire so you can script and run data functions or create predictive models.
TERR Tools are provided to give you access to the TERR console to test scripts and functions, and to the TERR Language Reference for help with installed packages.
You can use TERR Tools to launch the RStudio interactive development environment for script authoring. TERR Tools also provides an interface to download and install packages from the Comprehensive R Archive Network (CRAN).
Note: Some statistical methods below are accessible through the TERR engine in Spotfire via data functions
Data Relationships
Linear Regression
Spearman R
Anova
Kruskal-Wallis
Chi-square
Cluster Analysis
K-means
Hierarchical clustering
Regression
Linear regression
Polynomial regression
Model diagnostics
Prediction and confidence intervals
Parametric spline models
Logistic regression
Generalized linear models
Visually compare polynomial regression and traditional methods
Hypothesis Tests and Confidence Intervals through TERR engine
Proportions: exact Binomial test, Normal approximation
Contingency tables and tests for independence: Chi-square, Fisher, Mantel-Haenszel, McNemar
Analysis of Variance
Univariate and multivariate ANOVA
Flexible specification of variables, covariables, interactions, nesting, transformations
F-test to compare two variances
Multiple comparisons: Fisher, Tukey, Bonferroni
Nonlinear Regression and Maximum Likelihood
Nonlinear regression
Nonlinear maximum likelihood
Constrained nonlinear regression
Nonparametric Regression
Loess smoother
Super smoother
Kernel smoother
Spline smoother
Tree Models
Classification trees
Regression trees
Pruning, shrinking, and splitting
Scoring
Multivariate Analysis
Canonical correlation
Factor analysis
Principal components
Biplots
Time Series Analysis
Autocovariance, autocorrelation and partial autocorrelation
Box-Jenkins ARIMA models
Classical and robust AR
Seasonal decompositions
Fourier transformations
Classical and robust smoothers and filters
System Requirements
Processor
2GHz or faster, Quad core (2 GHz, Dual core, minimum)
RAM
8 GB or more (4 GB, minimum) Note: Large data sets can require more RAM.
Hard Disk
10 GB for installation and normal use.
Display
1920×1080 pixel resolution or higher, 16-bit or 32-bit color depth (1024×768 pixel resolution, 16-bit or 32-bit color depth, minimum)
Operating System
Microsoft® Windows 10 Microsoft® Windows 8, 8.1 Microsoft® Windows 7 Parallels Desktop 15 for MacOS X 10.10 – 10.15
Microsoft Office (Optional)
To use Spotfire functionality that integrates with Microsoft Office products, such as exporting to PowerPoint, importing data from Access, and importing data from older versions of Excel, Microsoft Office must be installed. The following versions of Microsoft Office are supported: Microsoft Office 365 Microsoft Office 2016, 32-bit and 64-bit versions Microsoft Office 2013, 32-bit and 64-bit versions Microsoft Office 2010, 32-bit and 64-bit versions