

Data Science Projects
Over twenty years of experience in delivering data science projects and predictive analytics solutions,
that accelerate competitive advantage.


Data Science Pilot Project
Use Case: Energy Load Forecasting
Customer: Aurora Energy, Hobart
Business value: Accuracy of load forecasts, has the potential to improve the effectiveness of the wholesale hedging strategy through greater flexibility in market exposure and sharper hedging procurement.
Scope: Develop automated load forecasting solution, which imports historical half hour customer account data, with functionality to modify parameters, and produce forecasts with confidence intervals.
Outcome: Delivered, short and long term forecasting solution, with a mean absolute percentage error (MAPE) of less than 6%.

Data Science Project
Use Case: Customer Analytics – Predicting Churn
Customer: Randstad Australia, Sydney
Business value: Reducing customer churn by a small percentage, can produce significant revenue gains.
Scope:
– Business analysis and engagement with stakeholders
– Data profiling and data preparation to support classification modelling and survival analysis
– Trained, tested and validated classification models, to determine accuracy
Outcome: Delivered predictive solution, with over 90% accuracy, that identifies customers with a high propensity to churn.
Data Science Production Project
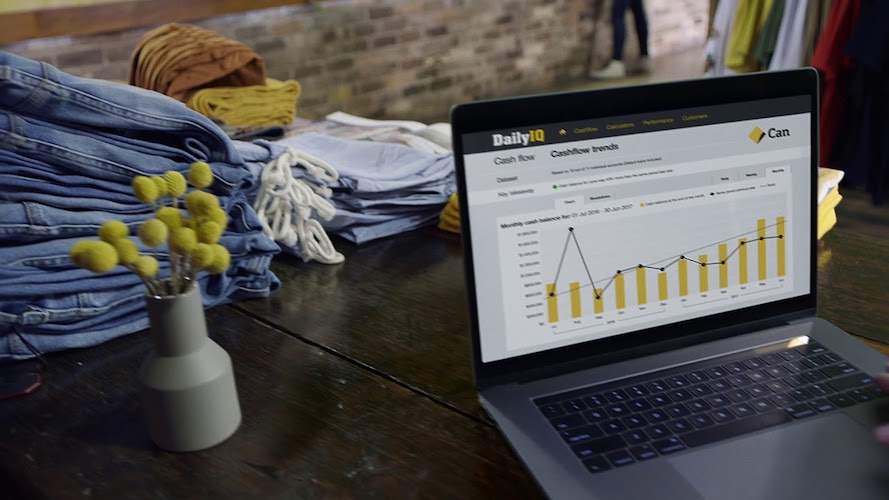
Use Case: Cash-flow Forecasting
Customer: Commonwealth Bank – Daily IQ Project, Sydney
Business value: Improve customer facing insights and provide internal cross-sell opportunities.
Scope:
– Develop customer facing, automated cashflow forecasting solution of business account balance data
– Backtest traditional and modern time series methods, to identify best performing models
– Deploy to production
Outcome:
– Solution implemented in Daily IQ application with over 50% of account forecasts producing a 7 day Mean Absolute Percentage Error, of less the 0.2%.
– Product manager received a CEO award.
Data Science POC
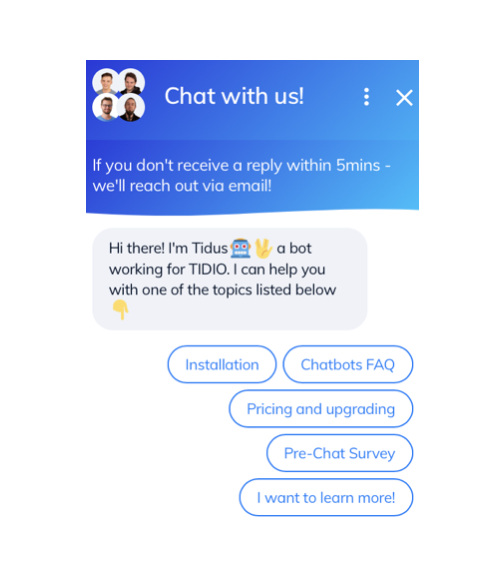
Use Case: Text Analytics of Jetstar customer web chats
Customer: Stellar, Sydney
Business value: Categorising and quantifying customer issues can significantly improve customer satisfaction and loyalty.
Scope:
– Data profiling of web chat data
– Descriptive analytics, including chat duration, word/term frequencies and automated categorisation
– Sentiment analysis
Outcome: Delivered insights into the quantity and types of issues, degree of resolution and resulting sentiment.
Data Science Project
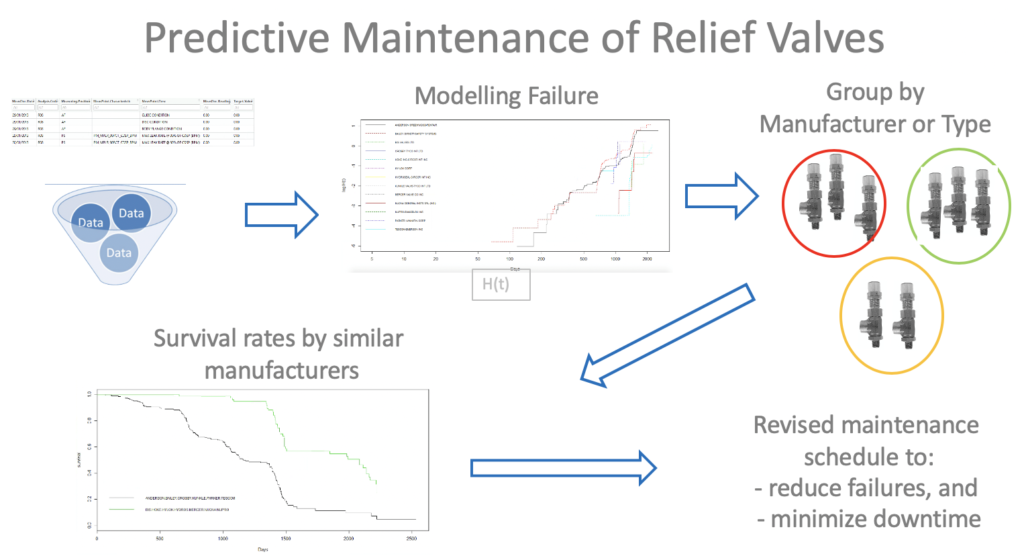
Use Case: Predictive Maintenance of Relief Valves
Customer: Woodside Energy, Perth
Business value: Revise maintenance schedule to minimise downtime and reduce failures.
Scope:
– Data profiling and data preparation to support survival analysis
– Developed model to describe the lifetime of a relief valve, accounting for Manufacturer and Construction Type
Outcome: Delivered automated solution that groups similar Manufacturers and Types of relief valves, enabling customisation of maintenance schedules and a reduction in failures.